
-
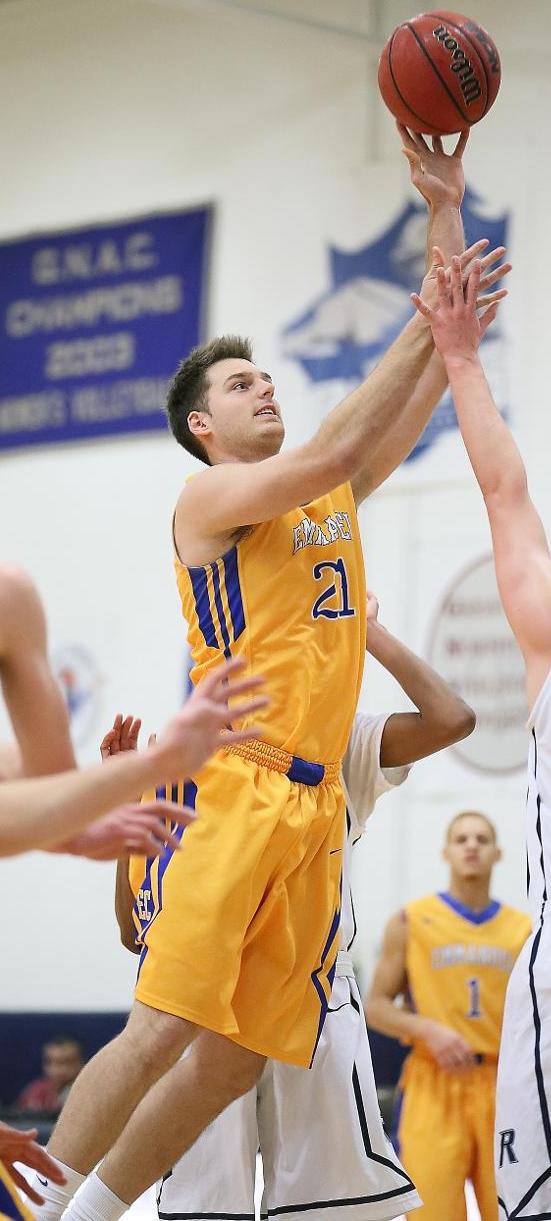
- Height:
- 6'7
-
- Weight:
- 215
-
- Year:
- So.
-
- Hometown:
- Owls Head, Maine
-
- High School:
- The Bullis School (Md.)
-
- Position:
- F
-
- gp
- 26
-
- pts/g
- 6.8
-
- fg %
- 46.2
-
- 3pt %
- 14.3
-
- ft %
- 76.9
-
- reb/g
- 5.8
-
- a/g
- 0.7
Bio
 AS A FRESHMAN ... Appeared in two games playing for NCAA Division I Stetson University before transferring.
BEFORE EMMANUEL ... Played basketball and soccer during freshman and sophomore years at Rockland District High School in Maine before moving to Maryland. Played basketball and ran track & field at The Bullis School during junior and senior years. Helped lead Bullis to a conference championship in 2012. Made honor roll all four years.
Major: Pre-med and Marketing
Career Aspirations: Surgeon
Favorite Movie: Ferris Bueller's Day Off
Favorite Book: Little Bee
Favorite Pre-Game Meal: PB&J
Favorite Late Night Snack: Cereal
Favorite Spot on the EC Campus: St. Joes gym
Best Class at EC: Business Ethics
Most Exciting Athletic Experience: Winning the I.A.C. Championship senior year of HS
Most Respected Professional Athlete: Kevin Reed
CAREER BESTS AT EC:
| Points | Rebounds | Assists | Steals | Blocks |
| 20 (2/24/15 vs. Anna Maria) | 12 (two times) | 2 (three times) | 4 (11/25/14 vs. Wheaton) | 3 (11/20/14 vs. Wesleyan) |
Recent games
Season Statistics
| Overall | Conference | |
|---|---|---|
| Games | 26 | 18 |
| Games started | 17 | 12 |
| Minutes | 575 | 371 |
| Minutes per game | 22.1 | 20.6 |
| FG | 73-158 | 41-100 |
| FG Pct | 46.2 | 41.0 |
| 3PT | 1-7 | 1-6 |
| 3PT Pct | 14.3 | 16.7 |
| FT | 30-39 | 22-29 |
| FT Pct | 76.9 | 75.9 |
| Off rebounds | 66 | 39 |
| Def rebounds | 85 | 57 |
| Total rebounds | 151 | 96 |
| Rebounds per game | 5.8 | 5.3 |
| Personal fouls | 44 | 30 |
| Disqualifications | 0 | 0 |
| Assists | 17 | 10 |
| Turnovers | 45 | 36 |
| Assist to turnover ratio | 0.4 | 0.3 |
| Steals | 17 | 7 |
| Blocks | 7 | 3 |
| Points | 177 | 105 |
| Points per game | 6.8 | 5.8 |
| Points per 40 min | 12.3 | 11.3 |
Game Log - Shooting
| Date | Opponent | Score | gs | min | fg | pct | 3pt | pct | ft | pct | pts |
|---|---|---|---|---|---|---|---|---|---|---|---|
| Nov 15 | Regis College | L, 76-59 | - | 20 | 4-7 | 57.1 | 0-0 | - | 0-0 | - | 8 |
| Nov 16 | Wentworth Institute of Technology | W, 47-40 | 1 | 29 | 5-12 | 41.7 | 0-0 | - | 0-0 | - | 10 |
| Nov 20 | at Wesleyan University | L, 76-54 | 1 | 25 | 2-4 | 50.0 | 0-0 | - | 0-0 | - | 4 |
| Nov 22 | Westfield State University | L, 81-69 | 1 | 32 | 4-9 | 44.4 | 0-0 | - | 3-4 | 75.0 | 11 |
| Nov 25 | Wheaton College | W, 80-65 | 1 | 28 | 3-4 | 75.0 | 0-0 | - | 0-0 | - | 6 |
| Dec 2 | at Rivier University | L, 71-61 | 1 | 17 | 1-2 | 50.0 | 0-0 | - | 1-2 | 50.0 | 3 |
| Dec 4 | St. Joseph's College (ME) | L, 73-69 | 1 | 22 | 4-7 | 57.1 | 0-0 | - | 0-0 | - | 8 |
| Dec 6 | at Mount Ida College | W, 68-64 | 1 | 26 | 3-7 | 42.9 | 0-1 | 0.0 | 0-0 | - | 6 |
| Dec 9 | at #15 MIT | L, 63-42 | 1 | 22 | 4-8 | 50.0 | 0-1 | 0.0 | 1-2 | 50.0 | 9 |
| Jan 6 | at Suffolk University | W, 84-75 | 1 | 29 | 2-6 | 33.3 | 0-0 | - | 0-0 | - | 4 |
| Jan 8 | Lasell University | L, 71-66 | 1 | 18 | 1-5 | 20.0 | 0-0 | - | 2-2 | 100.0 | 4 |
| Jan 10 | Anna Maria College | L, 65-48 | 1 | 26 | 1-4 | 25.0 | 0-0 | - | 1-2 | 50.0 | 3 |
| Jan 14 | #12 Albertus Magnus College | L, 84-58 | 1 | 18 | 1-4 | 25.0 | 0-0 | - | 0-0 | - | 2 |
| Jan 17 | at Norwich University | L, 71-66 | 1 | 24 | 2-4 | 50.0 | 0-0 | - | 0-0 | - | 4 |
| Jan 19 | at Johnson & Wales University | L, 74-48 | - | 5 | 1-3 | 33.3 | 0-0 | - | 0-0 | - | 2 |
| Jan 29 | Rivier University | W, 60-49 | - | 19 | 3-6 | 50.0 | 1-2 | 50.0 | 0-1 | 0.0 | 7 |
| Jan 31 | at Lasell University | W, 59-55 | - | 7 | 0-1 | 0.0 | 0-0 | - | 0-0 | - | 0 |
| Feb 4 | Mount Ida College | W, 70-64 | 1 | 22 | 5-11 | 45.5 | 0-1 | 0.0 | 1-1 | 100.0 | 11 |
| Feb 7 | Johnson & Wales University | L, 79-61 | - | 18 | 1-4 | 25.0 | 0-0 | - | 5-5 | 100.0 | 7 |
| Feb 10 | Norwich University | W, 68-64 | 1 | 34 | 6-12 | 50.0 | 0-1 | 0.0 | 1-4 | 25.0 | 13 |
| Feb 12 | at Anna Maria College | L, 85-84 | 1 | 19 | 1-4 | 25.0 | 0-0 | - | 3-3 | 100.0 | 5 |
| Feb 14 | at St. Joseph's College (ME) | L, 70-47 | 1 | 16 | 1-4 | 25.0 | 0-1 | 0.0 | 1-1 | 100.0 | 3 |
| Feb 17 | at #7 Albertus Magnus College | L, 99-89 | - | 32 | 6-10 | 60.0 | 0-0 | - | 2-2 | 100.0 | 14 |
| Feb 21 | Suffolk University | W, 69-59 | - | 19 | 2-6 | 33.3 | 0-0 | - | 5-6 | 83.3 | 9 |
| Feb 24 | at Anna Maria College | W, 76-73 | - | 26 | 8-9 | 88.9 | 0-0 | - | 4-4 | 100.0 | 20 |
| Feb 26 | at Johnson & Wales University | L, 77-43 | - | 22 | 2-5 | 40.0 | 0-0 | - | 0-0 | - | 4 |
Game Log - Ball control
| Date | Opponent | Score | gs | min | off | def | reb | ast | to | stl | blk |
|---|---|---|---|---|---|---|---|---|---|---|---|
| Nov 15 | Regis College | L, 76-59 | - | 20 | 1 | 2 | 3 | 0 | 1 | 2 | 0 |
| Nov 16 | Wentworth Institute of Technology | W, 47-40 | 1 | 29 | 9 | 3 | 12 | 1 | 1 | 0 | 0 |
| Nov 20 | at Wesleyan University | L, 76-54 | 1 | 25 | 1 | 3 | 4 | 1 | 0 | 1 | 3 |
| Nov 22 | Westfield State University | L, 81-69 | 1 | 32 | 5 | 7 | 12 | 2 | 4 | 1 | 0 |
| Nov 25 | Wheaton College | W, 80-65 | 1 | 28 | 2 | 4 | 6 | 1 | 1 | 4 | 0 |
| Dec 2 | at Rivier University | L, 71-61 | 1 | 17 | 1 | 3 | 4 | 1 | 0 | 0 | 0 |
| Dec 4 | St. Joseph's College (ME) | L, 73-69 | 1 | 22 | 3 | 2 | 5 | 1 | 1 | 0 | 0 |
| Dec 6 | at Mount Ida College | W, 68-64 | 1 | 26 | 0 | 5 | 5 | 1 | 2 | 0 | 0 |
| Dec 9 | at #15 MIT | L, 63-42 | 1 | 22 | 4 | 3 | 7 | 0 | 1 | 2 | 0 |
| Jan 6 | at Suffolk University | W, 84-75 | 1 | 29 | 1 | 2 | 3 | 0 | 1 | 0 | 0 |
| Jan 8 | Lasell University | L, 71-66 | 1 | 18 | 3 | 6 | 9 | 1 | 3 | 0 | 0 |
| Jan 10 | Anna Maria College | L, 65-48 | 1 | 26 | 2 | 5 | 7 | 0 | 1 | 0 | 1 |
| Jan 14 | #12 Albertus Magnus College | L, 84-58 | 1 | 18 | 1 | 2 | 3 | 0 | 2 | 1 | 0 |
| Jan 17 | at Norwich University | L, 71-66 | 1 | 24 | 2 | 3 | 5 | 1 | 2 | 0 | 0 |
| Jan 19 | at Johnson & Wales University | L, 74-48 | - | 5 | 1 | 0 | 1 | 0 | 0 | 0 | 0 |
| Jan 29 | Rivier University | W, 60-49 | - | 19 | 1 | 4 | 5 | 0 | 3 | 2 | 0 |
| Jan 31 | at Lasell University | W, 59-55 | - | 7 | 0 | 1 | 1 | 0 | 2 | 0 | 0 |
| Feb 4 | Mount Ida College | W, 70-64 | 1 | 22 | 3 | 6 | 9 | 2 | 2 | 0 | 0 |
| Feb 7 | Johnson & Wales University | L, 79-61 | - | 18 | 3 | 3 | 6 | 1 | 3 | 0 | 1 |
| Feb 10 | Norwich University | W, 68-64 | 1 | 34 | 6 | 3 | 9 | 1 | 2 | 2 | 0 |
| Feb 12 | at Anna Maria College | L, 85-84 | 1 | 19 | 4 | 1 | 5 | 0 | 4 | 0 | 0 |
| Feb 14 | at St. Joseph's College (ME) | L, 70-47 | 1 | 16 | 1 | 0 | 1 | 0 | 1 | 0 | 0 |
| Feb 17 | at #7 Albertus Magnus College | L, 99-89 | - | 32 | 4 | 4 | 8 | 1 | 3 | 1 | 0 |
| Feb 21 | Suffolk University | W, 69-59 | - | 19 | 3 | 7 | 10 | 0 | 4 | 1 | 1 |
| Feb 24 | at Anna Maria College | W, 76-73 | - | 26 | 4 | 6 | 10 | 2 | 0 | 0 | 0 |
| Feb 26 | at Johnson & Wales University | L, 77-43 | - | 22 | 1 | 0 | 1 | 0 | 1 | 0 | 1 |
Game Log - Ball control extended
| Date | Opponent | Score | gs | pf | dq | a/to |
|---|---|---|---|---|---|---|
| Nov 15 | Regis College | L, 76-59 | - | 3 | 0 | 0.0 |
| Nov 16 | Wentworth Institute of Technology | W, 47-40 | 1 | 0 | - | 1.0 |
| Nov 20 | at Wesleyan University | L, 76-54 | 1 | 2 | - | - |
| Nov 22 | Westfield State University | L, 81-69 | 1 | 1 | - | 0.5 |
| Nov 25 | Wheaton College | W, 80-65 | 1 | 3 | - | 1.0 |
| Dec 2 | at Rivier University | L, 71-61 | 1 | 1 | - | - |
| Dec 4 | St. Joseph's College (ME) | L, 73-69 | 1 | 2 | - | 1.0 |
| Dec 6 | at Mount Ida College | W, 68-64 | 1 | 4 | 0 | 0.5 |
| Dec 9 | at #15 MIT | L, 63-42 | 1 | 2 | - | 0.0 |
| Jan 6 | at Suffolk University | W, 84-75 | 1 | 1 | - | 0.0 |
| Jan 8 | Lasell University | L, 71-66 | 1 | 1 | 0 | 0.3 |
| Jan 10 | Anna Maria College | L, 65-48 | 1 | 2 | - | 0.0 |
| Jan 14 | #12 Albertus Magnus College | L, 84-58 | 1 | 1 | 0 | 0.0 |
| Jan 17 | at Norwich University | L, 71-66 | 1 | 1 | - | 0.5 |
| Jan 19 | at Johnson & Wales University | L, 74-48 | - | 1 | 0 | - |
| Jan 29 | Rivier University | W, 60-49 | - | 2 | - | 0.0 |
| Jan 31 | at Lasell University | W, 59-55 | - | 1 | - | 0.0 |
| Feb 4 | Mount Ida College | W, 70-64 | 1 | 3 | 0 | 1.0 |
| Feb 7 | Johnson & Wales University | L, 79-61 | - | 3 | 0 | 0.3 |
| Feb 10 | Norwich University | W, 68-64 | 1 | 2 | 0 | 0.5 |
| Feb 12 | at Anna Maria College | L, 85-84 | 1 | 3 | - | 0.0 |
| Feb 14 | at St. Joseph's College (ME) | L, 70-47 | 1 | 0 | - | 0.0 |
| Feb 17 | at #7 Albertus Magnus College | L, 99-89 | - | 2 | 0 | 0.3 |
| Feb 21 | Suffolk University | W, 69-59 | - | 0 | - | 0.0 |
| Feb 24 | at Anna Maria College | W, 76-73 | - | 1 | - | - |
| Feb 26 | at Johnson & Wales University | L, 77-43 | - | 2 | 0 | 0.0 |
| gp | min/g | fg/g | 3pt/g | ft/g | ppg | |
|---|---|---|---|---|---|---|
| Event | ||||||
| Total | 26 | 22.1 | 2.8-6.1 | 0.0-0.3 | 1.2-1.5 | 6.8 |
| Conference | 18 | 20.6 | 2.3-5.6 | 0.1-0.3 | 1.2-1.6 | 5.8 |
| Exhibition | - | - | 0.0-0.0 | 0.0-0.0 | 0.0-0.0 | - |
| Location | ||||||
| Home | 13 | 23.5 | 3.1-7.0 | 0.1-0.3 | 1.4-1.9 | 7.6 |
| Away | 13 | 20.8 | 2.5-5.2 | 0.0-0.2 | 0.9-1.1 | 6.0 |
| Neutral | - | - | 0.0-0.0 | 0.0-0.0 | 0.0-0.0 | - |
| Result | ||||||
| Wins | 10 | 23.9 | 3.7-7.4 | 0.1-0.5 | 1.1-1.6 | 8.6 |
| Losses | 16 | 21.0 | 2.2-5.2 | 0.0-0.1 | 1.2-1.4 | 5.7 |
| Month | ||||||
| November | 5 | 26.8 | 3.6-7.2 | 0.0-0.0 | 0.6-0.8 | 7.8 |
| December | 4 | 21.8 | 3.0-6.0 | 0.0-0.5 | 0.5-1.0 | 6.5 |
| January | 8 | 18.3 | 1.4-4.1 | 0.1-0.2 | 0.4-0.6 | 3.3 |
| February | 9 | 23.1 | 3.6-7.2 | 0.0-0.3 | 2.4-2.9 | 9.6 |
Splits Stats: Shooting per game
| gp | gs | min | fg | pct | 3pt | pct | ft | pct | pts | |
|---|---|---|---|---|---|---|---|---|---|---|
| Event | ||||||||||
| Total | 26 | 17 | 575 | 73-158 | 46.2 | 1-7 | 14.3 | 30-39 | 76.9 | 177 |
| Conference | 18 | 12 | 371 | 41-100 | 41.0 | 1-6 | 16.7 | 22-29 | 75.9 | 105 |
| Exhibition | - | - | - | 0-0 | - | 0-0 | - | 0-0 | - | 0 |
| Location | ||||||||||
| Home | 13 | 9 | 305 | 40-91 | 44.0 | 1-4 | 25.0 | 18-25 | 72.0 | 99 |
| Away | 13 | 8 | 270 | 33-67 | 49.3 | 0-3 | 0.0 | 12-14 | 85.7 | 78 |
| Neutral | - | - | - | 0-0 | - | 0-0 | - | 0-0 | - | 0 |
| Result | ||||||||||
| Wins | 10 | 6 | 239 | 37-74 | 50.0 | 1-5 | 20.0 | 11-16 | 68.8 | 86 |
| Losses | 16 | 11 | 336 | 36-84 | 42.9 | 0-2 | 0.0 | 19-23 | 82.6 | 91 |
| Month | ||||||||||
| November | 5 | 4 | 134 | 18-36 | 50.0 | 0-0 | - | 3-4 | 75.0 | 39 |
| December | 4 | 4 | 87 | 12-24 | 50.0 | 0-2 | 0.0 | 2-4 | 50.0 | 26 |
| January | 8 | 5 | 146 | 11-33 | 33.3 | 1-2 | 50.0 | 3-5 | 60.0 | 26 |
| February | 9 | 4 | 208 | 32-65 | 49.2 | 0-3 | 0.0 | 22-26 | 84.6 | 86 |
Splits Stats: Shooting totals
| gp | min | min/g | fg/40 | 3pt/40 | pct | ft/40 | pts/40 | |
|---|---|---|---|---|---|---|---|---|
| Event | ||||||||
| Total | 26 | 575 | 22.1 | 5.1-11.0 | 0.1-0.5 | 14.3 | 2.1-2.7 | 12.3 |
| Conference | 18 | 371 | 20.6 | 4.4-10.8 | 0.1-0.6 | 16.7 | 2.4-3.1 | 11.3 |
| Exhibition | - | - | - | 0.0-0.0 | 0.0-0.0 | - | 0.0-0.0 | - |
| Location | ||||||||
| Home | 13 | 305 | 23.5 | 5.2-11.9 | 0.1-0.5 | 25.0 | 2.4-3.3 | 13.0 |
| Away | 13 | 270 | 20.8 | 4.9-9.9 | 0.0-0.4 | 0.0 | 1.8-2.1 | 11.6 |
| Neutral | - | - | - | 0.0-0.0 | 0.0-0.0 | - | 0.0-0.0 | - |
| Result | ||||||||
| Wins | 10 | 239 | 23.9 | 6.2-12.4 | 0.2-0.8 | 20.0 | 1.8-2.7 | 14.4 |
| Losses | 16 | 336 | 21.0 | 4.3-10.0 | 0.0-0.2 | 0.0 | 2.3-2.7 | 10.8 |
| Month | ||||||||
| November | 5 | 134 | 26.8 | 5.4-10.7 | 0.0-0.0 | - | 0.9-1.2 | 11.6 |
| December | 4 | 87 | 21.8 | 5.5-11.0 | 0.0-0.9 | 0.0 | 0.9-1.8 | 12.0 |
| January | 8 | 146 | 18.3 | 3.0-9.0 | 0.3-0.5 | 50.0 | 0.8-1.4 | 7.1 |
| February | 9 | 208 | 23.1 | 6.2-12.5 | 0.0-0.6 | 0.0 | 4.2-5.0 | 16.5 |
Splits Stats: Shooting per 40 min
| gp | off/g | def/g | reb/g | ast/g | to/g | stl/g | blk/g | |
|---|---|---|---|---|---|---|---|---|
| Event | ||||||||
| Total | 26 | 2.5 | 3.3 | 5.8 | 0.7 | 1.7 | 0.7 | 0.3 |
| Conference | 18 | 2.2 | 3.2 | 5.3 | 0.6 | 2.0 | 0.4 | 0.2 |
| Exhibition | - | - | - | - | - | - | - | - |
| Location | ||||||||
| Home | 13 | 3.2 | 4.2 | 7.4 | 0.8 | 2.2 | 1.0 | 0.2 |
| Away | 13 | 1.8 | 2.4 | 4.2 | 0.5 | 1.3 | 0.3 | 0.3 |
| Neutral | - | - | - | - | - | - | - | - |
| Result | ||||||||
| Wins | 10 | 2.9 | 4.1 | 7.0 | 0.8 | 1.8 | 0.9 | 0.1 |
| Losses | 16 | 2.3 | 2.8 | 5.1 | 0.6 | 1.7 | 0.5 | 0.4 |
| Month | ||||||||
| November | 5 | 3.6 | 3.8 | 7.4 | 1.0 | 1.4 | 1.6 | 0.6 |
| December | 4 | 2.0 | 3.3 | 5.3 | 0.8 | 1.0 | 0.5 | 0.0 |
| January | 8 | 1.4 | 2.9 | 4.3 | 0.3 | 1.8 | 0.4 | 0.1 |
| February | 9 | 3.2 | 3.3 | 6.6 | 0.8 | 2.2 | 0.4 | 0.3 |
Splits Stats: Ball control per game
| gp | gs | off | def | reb | ast | to | stl | blk | |
|---|---|---|---|---|---|---|---|---|---|
| Event | |||||||||
| Total | 26 | 17 | 66 | 85 | 151 | 17 | 45 | 17 | 7 |
| Conference | 18 | 12 | 39 | 57 | 96 | 10 | 36 | 7 | 3 |
| Exhibition | - | - | - | - | - | - | - | - | - |
| Location | |||||||||
| Home | 13 | 9 | 42 | 54 | 96 | 10 | 28 | 13 | 3 |
| Away | 13 | 8 | 24 | 31 | 55 | 7 | 17 | 4 | 4 |
| Neutral | - | - | - | - | - | - | - | - | - |
| Result | |||||||||
| Wins | 10 | 6 | 29 | 41 | 70 | 8 | 18 | 9 | 1 |
| Losses | 16 | 11 | 37 | 44 | 81 | 9 | 27 | 8 | 6 |
| Month | |||||||||
| November | 5 | 4 | 18 | 19 | 37 | 5 | 7 | 8 | 3 |
| December | 4 | 4 | 8 | 13 | 21 | 3 | 4 | 2 | 0 |
| January | 8 | 5 | 11 | 23 | 34 | 2 | 14 | 3 | 1 |
| February | 9 | 4 | 29 | 30 | 59 | 7 | 20 | 4 | 3 |
Splits Stats: Ball control totals
| gp | off/40 | def/40 | reb/40 | ast/40 | to/40 | stl/40 | blk/40 | |
|---|---|---|---|---|---|---|---|---|
| Event | ||||||||
| Total | 26 | 4.6 | 5.9 | 10.5 | 1.2 | 3.1 | 1.2 | 0.5 |
| Conference | 18 | 4.2 | 6.1 | 10.4 | 1.1 | 3.9 | 0.8 | 0.3 |
| Exhibition | - | - | - | - | - | - | - | - |
| Location | ||||||||
| Home | 13 | 5.5 | 7.1 | 12.6 | 1.3 | 3.7 | 1.7 | 0.4 |
| Away | 13 | 3.6 | 4.6 | 8.1 | 1.0 | 2.5 | 0.6 | 0.6 |
| Neutral | - | - | - | - | - | - | - | - |
| Result | ||||||||
| Wins | 10 | 4.9 | 6.9 | 11.7 | 1.3 | 3.0 | 1.5 | 0.2 |
| Losses | 16 | 4.4 | 5.2 | 9.6 | 1.1 | 3.2 | 1.0 | 0.7 |
| Month | ||||||||
| November | 5 | 5.4 | 5.7 | 11.0 | 1.5 | 2.1 | 2.4 | 0.9 |
| December | 4 | 3.7 | 6.0 | 9.7 | 1.4 | 1.8 | 0.9 | 0.0 |
| January | 8 | 3.0 | 6.3 | 9.3 | 0.5 | 3.8 | 0.8 | 0.3 |
| February | 9 | 5.6 | 5.8 | 11.3 | 1.3 | 3.8 | 0.8 | 0.6 |
Splits Stats: Ball control per 40 min