
-
- Birth Date:
- February 17th
-
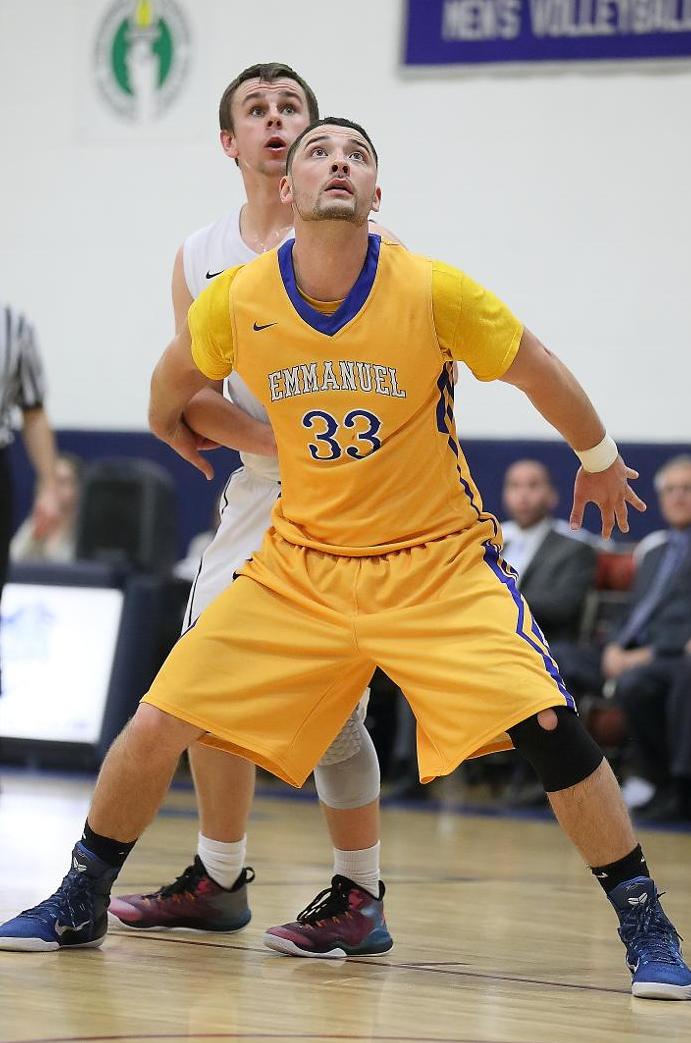
- Height:
- 6'6
-
- Weight:
- 235
-
- Year:
- Jr.
-
- Hometown:
- Groveland, Mass.
-
- High School:
- Haverhill
-
- Position:
- C
-
- gp
- 26
-
- pts/g
- 14.7
-
- fg %
- 47.5
-
- 3pt %
- 20.8
-
- ft %
- 47.5
-
- reb/g
- 7.7
-
- a/g
- 1.2
Bio
 AS A REDSHIRT JUNIOR ... Played in the season-opener vs. Emerson College before breaking a bone in his wrist to end the year ... In just 10 minutes of action, Davis scored eight points and grabbed four rebounds before fouling out of the contest.
BEFORE EMMANUEL ... Davis was a two-year starting forward at Northern Essex Community College ... 2-time National Junior College Athletic Association (NJCAA) All-Conference and All-New England ... averaged 20 points and 10 rebounds in his second junior college season ... played three varsity sports for three years at Haverhill High School (Haverhill, Mass.), including football, basketball and baseball.
Major: Psychology
Career Aspirations: to be a sport psychologist
Favorite Pre-game Meal: Popeye's chicken
Favorite Movie: The Blindside
Favorite Spot on the EC Campus: Muddy River cafe
CAREER BESTS:
| Points | Rebounds | Assists | Steals | Blocks |
| 33 (12/6/14 vs. Mount Ida) | 21 (1/17/15 vs. Norwich) *program record | 4 (two times) | 3 (two times) | 3 (three times) |
Recent games
Season Statistics
| Overall | Conference | |
|---|---|---|
| Games | 26 | 18 |
| Games started | 20 | 15 |
| Minutes | 622 | 452 |
| Minutes per game | 23.9 | 25.1 |
| FG | 160-337 | 125-258 |
| FG Pct | 47.5 | 48.4 |
| 3PT | 5-24 | 5-19 |
| 3PT Pct | 20.8 | 26.3 |
| FT | 57-120 | 54-104 |
| FT Pct | 47.5 | 51.9 |
| Off rebounds | 89 | 71 |
| Def rebounds | 110 | 70 |
| Total rebounds | 199 | 141 |
| Rebounds per game | 7.7 | 7.8 |
| Personal fouls | 97 | 64 |
| Disqualifications | 10 | 7 |
| Assists | 32 | 26 |
| Turnovers | 67 | 48 |
| Assist to turnover ratio | 0.5 | 0.5 |
| Steals | 27 | 19 |
| Blocks | 19 | 14 |
| Points | 382 | 309 |
| Points per game | 14.7 | 17.2 |
| Points per 40 min | 24.6 | 27.3 |
Game Log - Shooting
| Date | Opponent | Score | gs | min | fg | pct | 3pt | pct | ft | pct | pts |
|---|---|---|---|---|---|---|---|---|---|---|---|
| Nov 15 | Regis College | L, 76-59 | 1 | 25 | 4-10 | 40.0 | 0-2 | 0.0 | 0-0 | - | 8 |
| Nov 16 | Wentworth Institute of Technology | W, 47-40 | 1 | 16 | 3-7 | 42.9 | 0-0 | - | 0-3 | 0.0 | 6 |
| Nov 20 | at Wesleyan University | L, 76-54 | 1 | 21 | 5-13 | 38.5 | 0-1 | 0.0 | 0-0 | - | 10 |
| Nov 22 | Westfield State University | L, 81-69 | - | 22 | 7-12 | 58.3 | 0-0 | - | 2-7 | 28.6 | 16 |
| Nov 25 | Wheaton College | W, 80-65 | - | 19 | 4-10 | 40.0 | 0-1 | 0.0 | 0-1 | 0.0 | 8 |
| Dec 2 | at Rivier University | L, 71-61 | 1 | 18 | 3-10 | 30.0 | 0-1 | 0.0 | 0-2 | 0.0 | 6 |
| Dec 4 | St. Joseph's College (ME) | L, 73-69 | - | 21 | 8-13 | 61.5 | 0-0 | - | 3-4 | 75.0 | 19 |
| Dec 6 | at Mount Ida College | W, 68-64 | - | 22 | 13-24 | 54.2 | 0-0 | - | 7-9 | 77.8 | 33 |
| Dec 9 | at #15 MIT | L, 63-42 | - | 23 | 5-11 | 45.5 | 0-1 | 0.0 | 1-4 | 25.0 | 11 |
| Jan 6 | at Suffolk University | W, 84-75 | 1 | 20 | 5-9 | 55.6 | 2-3 | 66.7 | 2-5 | 40.0 | 14 |
| Jan 8 | Lasell University | L, 71-66 | 1 | 23 | 6-13 | 46.2 | 0-1 | 0.0 | 2-5 | 40.0 | 14 |
| Jan 10 | Anna Maria College | L, 65-48 | 1 | 21 | 5-11 | 45.5 | 0-0 | - | 3-4 | 75.0 | 13 |
| Jan 14 | #12 Albertus Magnus College | L, 84-58 | 1 | 21 | 9-19 | 47.4 | 1-3 | 33.3 | 0-1 | 0.0 | 19 |
| Jan 17 | at Norwich University | L, 71-66 | 1 | 31 | 11-22 | 50.0 | 2-4 | 50.0 | 5-12 | 41.7 | 29 |
| Jan 19 | at Johnson & Wales University | L, 74-48 | 1 | 27 | 6-14 | 42.9 | 0-0 | - | 3-4 | 75.0 | 15 |
| Jan 29 | Rivier University | W, 60-49 | 1 | 29 | 8-16 | 50.0 | 0-4 | 0.0 | 5-9 | 55.6 | 21 |
| Jan 31 | at Lasell University | W, 59-55 | 1 | 25 | 9-17 | 52.9 | 0-0 | - | 5-7 | 71.4 | 23 |
| Feb 4 | Mount Ida College | W, 70-64 | - | 31 | 6-13 | 46.2 | 0-0 | - | 3-6 | 50.0 | 15 |
| Feb 7 | Johnson & Wales University | L, 79-61 | 1 | 24 | 7-13 | 53.8 | 0-1 | 0.0 | 3-6 | 50.0 | 17 |
| Feb 10 | Norwich University | W, 68-64 | 1 | 22 | 2-9 | 22.2 | 0-1 | 0.0 | 2-4 | 50.0 | 6 |
| Feb 12 | at Anna Maria College | L, 85-84 | 1 | 32 | 7-15 | 46.7 | 0-1 | 0.0 | 6-11 | 54.5 | 20 |
| Feb 14 | at St. Joseph's College (ME) | L, 70-47 | 1 | 26 | 7-10 | 70.0 | 0-0 | - | 2-3 | 66.7 | 16 |
| Feb 17 | at #7 Albertus Magnus College | L, 99-89 | 1 | 32 | 6-17 | 35.3 | 0-0 | - | 1-6 | 16.7 | 13 |
| Feb 21 | Suffolk University | W, 69-59 | 1 | 27 | 7-13 | 53.8 | 0-0 | - | 2-6 | 33.3 | 16 |
| Feb 24 | at Anna Maria College | W, 76-73 | 1 | 24 | 4-8 | 50.0 | 0-0 | - | 0-0 | - | 8 |
| Feb 26 | at Johnson & Wales University | L, 77-43 | 1 | 20 | 3-8 | 37.5 | 0-0 | - | 0-1 | 0.0 | 6 |
Game Log - Ball control
| Date | Opponent | Score | gs | min | off | def | reb | ast | to | stl | blk |
|---|---|---|---|---|---|---|---|---|---|---|---|
| Nov 15 | Regis College | L, 76-59 | 1 | 25 | 1 | 6 | 7 | 2 | 1 | 0 | 3 |
| Nov 16 | Wentworth Institute of Technology | W, 47-40 | 1 | 16 | 0 | 3 | 3 | 0 | 3 | 0 | 0 |
| Nov 20 | at Wesleyan University | L, 76-54 | 1 | 21 | 1 | 7 | 8 | 1 | 0 | 0 | 0 |
| Nov 22 | Westfield State University | L, 81-69 | - | 22 | 7 | 6 | 13 | 1 | 3 | 0 | 1 |
| Nov 25 | Wheaton College | W, 80-65 | - | 19 | 2 | 7 | 9 | 2 | 2 | 2 | 0 |
| Dec 2 | at Rivier University | L, 71-61 | 1 | 18 | 5 | 3 | 8 | 0 | 0 | 0 | 0 |
| Dec 4 | St. Joseph's College (ME) | L, 73-69 | - | 21 | 3 | 1 | 4 | 1 | 2 | 6 | 1 |
| Dec 6 | at Mount Ida College | W, 68-64 | - | 22 | 6 | 2 | 8 | 1 | 2 | 1 | 0 |
| Dec 9 | at #15 MIT | L, 63-42 | - | 23 | 3 | 3 | 6 | 0 | 5 | 2 | 1 |
| Jan 6 | at Suffolk University | W, 84-75 | 1 | 20 | 1 | 4 | 5 | 4 | 2 | 0 | 0 |
| Jan 8 | Lasell University | L, 71-66 | 1 | 23 | 4 | 4 | 8 | 0 | 3 | 0 | 0 |
| Jan 10 | Anna Maria College | L, 65-48 | 1 | 21 | 3 | 2 | 5 | 0 | 3 | 0 | 0 |
| Jan 14 | #12 Albertus Magnus College | L, 84-58 | 1 | 21 | 5 | 5 | 10 | 3 | 2 | 0 | 1 |
| Jan 17 | at Norwich University | L, 71-66 | 1 | 31 | 11 | 10 | 21 | 4 | 6 | 2 | 1 |
| Jan 19 | at Johnson & Wales University | L, 74-48 | 1 | 27 | 2 | 6 | 8 | 1 | 2 | 1 | 1 |
| Jan 29 | Rivier University | W, 60-49 | 1 | 29 | 7 | 4 | 11 | 1 | 3 | 1 | 1 |
| Jan 31 | at Lasell University | W, 59-55 | 1 | 25 | 4 | 5 | 9 | 3 | 7 | 0 | 0 |
| Feb 4 | Mount Ida College | W, 70-64 | - | 31 | 4 | 2 | 6 | 3 | 2 | 2 | 0 |
| Feb 7 | Johnson & Wales University | L, 79-61 | 1 | 24 | 1 | 4 | 5 | 1 | 2 | 0 | 3 |
| Feb 10 | Norwich University | W, 68-64 | 1 | 22 | 0 | 0 | 0 | 0 | 0 | 0 | 0 |
| Feb 12 | at Anna Maria College | L, 85-84 | 1 | 32 | 4 | 7 | 11 | 0 | 1 | 0 | 3 |
| Feb 14 | at St. Joseph's College (ME) | L, 70-47 | 1 | 26 | 5 | 3 | 8 | 0 | 5 | 3 | 1 |
| Feb 17 | at #7 Albertus Magnus College | L, 99-89 | 1 | 32 | 3 | 2 | 5 | 3 | 4 | 1 | 1 |
| Feb 21 | Suffolk University | W, 69-59 | 1 | 27 | 3 | 6 | 9 | 1 | 2 | 2 | 1 |
| Feb 24 | at Anna Maria College | W, 76-73 | 1 | 24 | 1 | 5 | 6 | 0 | 2 | 1 | 0 |
| Feb 26 | at Johnson & Wales University | L, 77-43 | 1 | 20 | 3 | 3 | 6 | 0 | 3 | 3 | 0 |
Game Log - Ball control extended
| Date | Opponent | Score | gs | pf | dq | a/to |
|---|---|---|---|---|---|---|
| Nov 15 | Regis College | L, 76-59 | 1 | 4 | 0 | 2.0 |
| Nov 16 | Wentworth Institute of Technology | W, 47-40 | 1 | 4 | - | 0.0 |
| Nov 20 | at Wesleyan University | L, 76-54 | 1 | 4 | - | - |
| Nov 22 | Westfield State University | L, 81-69 | - | 5 | 1 | 0.3 |
| Nov 25 | Wheaton College | W, 80-65 | - | 5 | 1 | 1.0 |
| Dec 2 | at Rivier University | L, 71-61 | 1 | 5 | 1 | - |
| Dec 4 | St. Joseph's College (ME) | L, 73-69 | - | 2 | - | 0.5 |
| Dec 6 | at Mount Ida College | W, 68-64 | - | 2 | 0 | 0.5 |
| Dec 9 | at #15 MIT | L, 63-42 | - | 3 | - | 0.0 |
| Jan 6 | at Suffolk University | W, 84-75 | 1 | 5 | 1 | 2.0 |
| Jan 8 | Lasell University | L, 71-66 | 1 | 5 | 1 | 0.0 |
| Jan 10 | Anna Maria College | L, 65-48 | 1 | 3 | - | 0.0 |
| Jan 14 | #12 Albertus Magnus College | L, 84-58 | 1 | 2 | 0 | 1.5 |
| Jan 17 | at Norwich University | L, 71-66 | 1 | 5 | 1 | 0.7 |
| Jan 19 | at Johnson & Wales University | L, 74-48 | 1 | 3 | 0 | 0.5 |
| Jan 29 | Rivier University | W, 60-49 | 1 | 4 | - | 0.3 |
| Jan 31 | at Lasell University | W, 59-55 | 1 | 3 | - | 0.4 |
| Feb 4 | Mount Ida College | W, 70-64 | - | 2 | 0 | 1.5 |
| Feb 7 | Johnson & Wales University | L, 79-61 | 1 | 5 | 1 | 0.5 |
| Feb 10 | Norwich University | W, 68-64 | 1 | 3 | 0 | - |
| Feb 12 | at Anna Maria College | L, 85-84 | 1 | 2 | - | 0.0 |
| Feb 14 | at St. Joseph's College (ME) | L, 70-47 | 1 | 5 | 1 | 0.0 |
| Feb 17 | at #7 Albertus Magnus College | L, 99-89 | 1 | 5 | 1 | 0.8 |
| Feb 21 | Suffolk University | W, 69-59 | 1 | 3 | - | 0.5 |
| Feb 24 | at Anna Maria College | W, 76-73 | 1 | 5 | 1 | 0.0 |
| Feb 26 | at Johnson & Wales University | L, 77-43 | 1 | 3 | 0 | 0.0 |
| gp | min/g | fg/g | 3pt/g | ft/g | ppg | |
|---|---|---|---|---|---|---|
| Event | ||||||
| Total | 26 | 23.9 | 6.2-13.0 | 0.2-0.9 | 2.2-4.6 | 14.7 |
| Conference | 18 | 25.1 | 6.9-14.3 | 0.3-1.1 | 3.0-5.8 | 17.2 |
| Exhibition | - | - | 0.0-0.0 | 0.0-0.0 | 0.0-0.0 | - |
| Location | ||||||
| Home | 13 | 23.2 | 5.8-12.2 | 0.1-1.0 | 1.9-4.3 | 13.7 |
| Away | 13 | 24.7 | 6.5-13.7 | 0.3-0.8 | 2.5-4.9 | 15.7 |
| Neutral | - | - | 0.0-0.0 | 0.0-0.0 | 0.0-0.0 | - |
| Result | ||||||
| Wins | 10 | 23.5 | 6.1-12.6 | 0.2-0.9 | 2.6-5.0 | 15.0 |
| Losses | 16 | 24.2 | 6.2-13.2 | 0.2-0.9 | 1.9-4.4 | 14.5 |
| Month | ||||||
| November | 5 | 20.6 | 4.6-10.4 | 0.0-0.8 | 0.4-2.2 | 9.6 |
| December | 4 | 21.0 | 7.2-14.5 | 0.0-0.5 | 2.8-4.8 | 17.3 |
| January | 8 | 24.6 | 7.4-15.1 | 0.6-1.9 | 3.1-5.9 | 18.5 |
| February | 9 | 26.4 | 5.4-11.8 | 0.0-0.3 | 2.1-4.8 | 13.0 |
Splits Stats: Shooting per game
| gp | gs | min | fg | pct | 3pt | pct | ft | pct | pts | |
|---|---|---|---|---|---|---|---|---|---|---|
| Event | ||||||||||
| Total | 26 | 20 | 622 | 160-337 | 47.5 | 5-24 | 20.8 | 57-120 | 47.5 | 382 |
| Conference | 18 | 15 | 452 | 125-258 | 48.4 | 5-19 | 26.3 | 54-104 | 51.9 | 309 |
| Exhibition | - | - | - | 0-0 | - | 0-0 | - | 0-0 | - | 0 |
| Location | ||||||||||
| Home | 13 | 9 | 301 | 76-159 | 47.8 | 1-13 | 7.7 | 25-56 | 44.6 | 178 |
| Away | 13 | 11 | 321 | 84-178 | 47.2 | 4-11 | 36.4 | 32-64 | 50.0 | 204 |
| Neutral | - | - | - | 0-0 | - | 0-0 | - | 0-0 | - | 0 |
| Result | ||||||||||
| Wins | 10 | 7 | 235 | 61-126 | 48.4 | 2-9 | 22.2 | 26-50 | 52.0 | 150 |
| Losses | 16 | 13 | 387 | 99-211 | 46.9 | 3-15 | 20.0 | 31-70 | 44.3 | 232 |
| Month | ||||||||||
| November | 5 | 3 | 103 | 23-52 | 44.2 | 0-4 | 0.0 | 2-11 | 18.2 | 48 |
| December | 4 | 1 | 84 | 29-58 | 50.0 | 0-2 | 0.0 | 11-19 | 57.9 | 69 |
| January | 8 | 8 | 197 | 59-121 | 48.8 | 5-15 | 33.3 | 25-47 | 53.2 | 148 |
| February | 9 | 8 | 238 | 49-106 | 46.2 | 0-3 | 0.0 | 19-43 | 44.2 | 117 |
Splits Stats: Shooting totals
| gp | min | min/g | fg/40 | 3pt/40 | pct | ft/40 | pts/40 | |
|---|---|---|---|---|---|---|---|---|
| Event | ||||||||
| Total | 26 | 622 | 23.9 | 10.3-21.7 | 0.3-1.5 | 20.8 | 3.7-7.7 | 24.6 |
| Conference | 18 | 452 | 25.1 | 11.1-22.8 | 0.4-1.7 | 26.3 | 4.8-9.2 | 27.3 |
| Exhibition | - | - | - | 0.0-0.0 | 0.0-0.0 | - | 0.0-0.0 | - |
| Location | ||||||||
| Home | 13 | 301 | 23.2 | 10.1-21.1 | 0.1-1.7 | 7.7 | 3.3-7.4 | 23.7 |
| Away | 13 | 321 | 24.7 | 10.5-22.2 | 0.5-1.4 | 36.4 | 4.0-8.0 | 25.4 |
| Neutral | - | - | - | 0.0-0.0 | 0.0-0.0 | - | 0.0-0.0 | - |
| Result | ||||||||
| Wins | 10 | 235 | 23.5 | 10.4-21.4 | 0.3-1.5 | 22.2 | 4.4-8.5 | 25.5 |
| Losses | 16 | 387 | 24.2 | 10.2-21.8 | 0.3-1.6 | 20.0 | 3.2-7.2 | 24.0 |
| Month | ||||||||
| November | 5 | 103 | 20.6 | 8.9-20.2 | 0.0-1.6 | 0.0 | 0.8-4.3 | 18.6 |
| December | 4 | 84 | 21.0 | 13.8-27.6 | 0.0-1.0 | 0.0 | 5.2-9.0 | 32.9 |
| January | 8 | 197 | 24.6 | 12.0-24.6 | 1.0-3.0 | 33.3 | 5.1-9.5 | 30.1 |
| February | 9 | 238 | 26.4 | 8.2-17.8 | 0.0-0.5 | 0.0 | 3.2-7.2 | 19.7 |
Splits Stats: Shooting per 40 min
| gp | off/g | def/g | reb/g | ast/g | to/g | stl/g | blk/g | |
|---|---|---|---|---|---|---|---|---|
| Event | ||||||||
| Total | 26 | 3.4 | 4.2 | 7.7 | 1.2 | 2.6 | 1.0 | 0.7 |
| Conference | 18 | 3.9 | 3.9 | 7.8 | 1.4 | 2.7 | 1.1 | 0.8 |
| Exhibition | - | - | - | - | - | - | - | - |
| Location | ||||||||
| Home | 13 | 3.1 | 3.8 | 6.9 | 1.2 | 2.2 | 1.0 | 0.8 |
| Away | 13 | 3.8 | 4.6 | 8.4 | 1.3 | 3.0 | 1.1 | 0.6 |
| Neutral | - | - | - | - | - | - | - | - |
| Result | ||||||||
| Wins | 10 | 2.8 | 3.8 | 6.6 | 1.5 | 2.5 | 0.9 | 0.2 |
| Losses | 16 | 3.8 | 4.5 | 8.3 | 1.1 | 2.6 | 1.1 | 1.1 |
| Month | ||||||||
| November | 5 | 2.2 | 5.8 | 8.0 | 1.2 | 1.8 | 0.4 | 0.8 |
| December | 4 | 4.3 | 2.3 | 6.5 | 0.5 | 2.3 | 2.3 | 0.5 |
| January | 8 | 4.6 | 5.0 | 9.6 | 2.0 | 3.5 | 0.5 | 0.5 |
| February | 9 | 2.7 | 3.6 | 6.2 | 0.9 | 2.3 | 1.3 | 1.0 |
Splits Stats: Ball control per game
| gp | gs | off | def | reb | ast | to | stl | blk | |
|---|---|---|---|---|---|---|---|---|---|
| Event | |||||||||
| Total | 26 | 20 | 89 | 110 | 199 | 32 | 67 | 27 | 19 |
| Conference | 18 | 15 | 71 | 70 | 141 | 26 | 48 | 19 | 14 |
| Exhibition | - | - | - | - | - | - | - | - | - |
| Location | |||||||||
| Home | 13 | 9 | 40 | 50 | 90 | 15 | 28 | 13 | 11 |
| Away | 13 | 11 | 49 | 60 | 109 | 17 | 39 | 14 | 8 |
| Neutral | - | - | - | - | - | - | - | - | - |
| Result | |||||||||
| Wins | 10 | 7 | 28 | 38 | 66 | 15 | 25 | 9 | 2 |
| Losses | 16 | 13 | 61 | 72 | 133 | 17 | 42 | 18 | 17 |
| Month | |||||||||
| November | 5 | 3 | 11 | 29 | 40 | 6 | 9 | 2 | 4 |
| December | 4 | 1 | 17 | 9 | 26 | 2 | 9 | 9 | 2 |
| January | 8 | 8 | 37 | 40 | 77 | 16 | 28 | 4 | 4 |
| February | 9 | 8 | 24 | 32 | 56 | 8 | 21 | 12 | 9 |
Splits Stats: Ball control totals
| gp | off/40 | def/40 | reb/40 | ast/40 | to/40 | stl/40 | blk/40 | |
|---|---|---|---|---|---|---|---|---|
| Event | ||||||||
| Total | 26 | 5.7 | 7.1 | 12.8 | 2.1 | 4.3 | 1.7 | 1.2 |
| Conference | 18 | 6.3 | 6.2 | 12.5 | 2.3 | 4.2 | 1.7 | 1.2 |
| Exhibition | - | - | - | - | - | - | - | - |
| Location | ||||||||
| Home | 13 | 5.3 | 6.6 | 12.0 | 2.0 | 3.7 | 1.7 | 1.5 |
| Away | 13 | 6.1 | 7.5 | 13.6 | 2.1 | 4.9 | 1.7 | 1.0 |
| Neutral | - | - | - | - | - | - | - | - |
| Result | ||||||||
| Wins | 10 | 4.8 | 6.5 | 11.2 | 2.6 | 4.3 | 1.5 | 0.3 |
| Losses | 16 | 6.3 | 7.4 | 13.7 | 1.8 | 4.3 | 1.9 | 1.8 |
| Month | ||||||||
| November | 5 | 4.3 | 11.3 | 15.5 | 2.3 | 3.5 | 0.8 | 1.6 |
| December | 4 | 8.1 | 4.3 | 12.4 | 1.0 | 4.3 | 4.3 | 1.0 |
| January | 8 | 7.5 | 8.1 | 15.6 | 3.2 | 5.7 | 0.8 | 0.8 |
| February | 9 | 4.0 | 5.4 | 9.4 | 1.3 | 3.5 | 2.0 | 1.5 |
Splits Stats: Ball control per 40 min