
-
- Birth Date:
- February 14th
-
- Height:
- 6'2
-
- Weight:
- 170
-
- Year:
- Fr.
-
- Hometown:
- Hurst, Texas
-
- High School:
- L.D. Bell
-
- Position:
- G
-
- gp
- 22
-
- pts/g
- 6.2
-
- fg %
- 39.5
-
- 3pt %
- 31.7
-
- ft %
- 58.3
-
- reb/g
- 2.1
-
- a/g
- 1.0
Bio
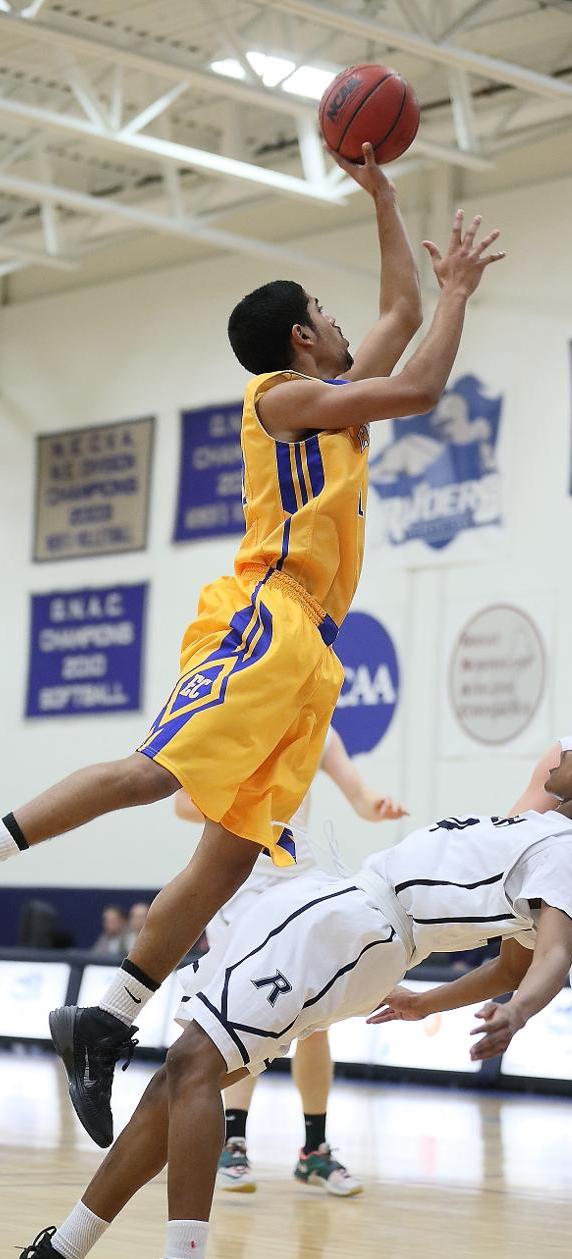 BEFORE EMMANUEL ... Three-year varsity basketball player at L.D. Bell HS in Hurst, Texas ... Competed on teams that played in the second highest division in the state of Texas ... Was a two-year starter.
Major: Business Management
Career Aspirations: Real Estate owner
Favorite Book: The Art of War
Favorite Pre-Game Meal: Spaghetti
Favorite Late Night Snack: Macaroni
Favorite Spot on the EC Campus: The 5th Floor Computer Lab
Most Exciting Athletic Experience: Winning the area championship in 9th grade
Most Respected Professional Athlete: Michael Jordan
CAREER BESTS:
| Points | Rebounds | Assists | Steals | Blocks |
| 14 (2/12/15 vs. Anna Maria) | 6 (2/12/15 vs. Anna Maria) | 3 (2/24/15 vs. Anna Maria) | 2 (two times) | 1 (four times) |
Recent games
Season Statistics
| Overall | Conference | |
|---|---|---|
| Games | 22 | 15 |
| Games started | 12 | 10 |
| Minutes | 371 | 245 |
| Minutes per game | 16.9 | 16.3 |
| FG | 51-129 | 31-76 |
| FG Pct | 39.5 | 40.8 |
| 3PT | 13-41 | 6-23 |
| 3PT Pct | 31.7 | 26.1 |
| FT | 21-36 | 7-13 |
| FT Pct | 58.3 | 53.8 |
| Off rebounds | 10 | 6 |
| Def rebounds | 36 | 22 |
| Total rebounds | 46 | 28 |
| Rebounds per game | 2.1 | 1.9 |
| Personal fouls | 34 | 26 |
| Disqualifications | 0 | 0 |
| Assists | 23 | 13 |
| Turnovers | 35 | 22 |
| Assist to turnover ratio | 0.7 | 0.6 |
| Steals | 14 | 10 |
| Blocks | 4 | 2 |
| Points | 136 | 75 |
| Points per game | 6.2 | 5.0 |
| Points per 40 min | 14.7 | 12.2 |
Game Log - Shooting
| Date | Opponent | Score | gs | min | fg | pct | 3pt | pct | ft | pct | pts |
|---|---|---|---|---|---|---|---|---|---|---|---|
| Nov 15 | Regis College | L, 76-59 | - | 20 | 2-5 | 40.0 | 0-2 | 0.0 | 3-3 | 100.0 | 7 |
| Nov 16 | Wentworth Institute of Technology | W, 47-40 | - | 15 | 2-5 | 40.0 | 1-1 | 100.0 | 0-0 | - | 5 |
| Nov 20 | at Wesleyan University | L, 76-54 | - | 19 | 3-4 | 75.0 | 3-3 | 100.0 | 3-4 | 75.0 | 12 |
| Nov 22 | Westfield State University | L, 81-69 | - | 20 | 3-9 | 33.3 | 1-2 | 50.0 | 1-5 | 20.0 | 8 |
| Nov 25 | Wheaton College | W, 80-65 | - | 12 | 3-6 | 50.0 | 1-3 | 33.3 | 3-4 | 75.0 | 10 |
| Dec 2 | at Rivier University | L, 71-61 | - | 12 | 1-4 | 25.0 | 0-1 | 0.0 | 0-0 | - | 2 |
| Dec 4 | St. Joseph's College (ME) | L, 73-69 | - | - | - | - | - | - | - | - | - |
| Dec 6 | at Mount Ida College | W, 68-64 | - | - | - | - | - | - | - | - | - |
| Dec 9 | at #15 MIT | L, 63-42 | - | - | - | - | - | - | - | - | - |
| Jan 6 | at Suffolk University | W, 84-75 | 1 | 19 | 2-3 | 66.7 | 1-1 | 100.0 | 0-2 | 0.0 | 5 |
| Jan 8 | Lasell University | L, 71-66 | 1 | 22 | 3-8 | 37.5 | 0-2 | 0.0 | 0-0 | - | 6 |
| Jan 10 | Anna Maria College | L, 65-48 | 1 | 15 | 1-5 | 20.0 | 0-1 | 0.0 | 0-0 | - | 2 |
| Jan 14 | #12 Albertus Magnus College | L, 84-58 | - | 12 | 1-3 | 33.3 | 0-0 | - | 0-0 | - | 2 |
| Jan 17 | at Norwich University | L, 71-66 | - | 15 | 2-3 | 66.7 | 0-0 | - | 0-0 | - | 4 |
| Jan 19 | at Johnson & Wales University | L, 74-48 | - | - | - | - | - | - | - | - | - |
| Jan 29 | Rivier University | W, 60-49 | 1 | 23 | 2-6 | 33.3 | 1-3 | 33.3 | 0-0 | - | 5 |
| Jan 31 | at Lasell University | W, 59-55 | 1 | 23 | 2-4 | 50.0 | 0-1 | 0.0 | 4-4 | 100.0 | 8 |
| Feb 4 | Mount Ida College | W, 70-64 | 1 | 10 | 1-3 | 33.3 | 0-2 | 0.0 | 0-0 | - | 2 |
| Feb 7 | Johnson & Wales University | L, 79-61 | 1 | 7 | 0-2 | 0.0 | 0-1 | 0.0 | 0-0 | - | 0 |
| Feb 10 | Norwich University | W, 68-64 | 1 | 9 | 2-4 | 50.0 | 0-1 | 0.0 | 0-0 | - | 4 |
| Feb 12 | at Anna Maria College | L, 85-84 | 1 | 30 | 6-9 | 66.7 | 2-3 | 66.7 | 0-1 | 0.0 | 14 |
| Feb 14 | at St. Joseph's College (ME) | L, 70-47 | 1 | 27 | 4-11 | 36.4 | 1-5 | 20.0 | 0-0 | - | 9 |
| Feb 17 | at #7 Albertus Magnus College | L, 99-89 | - | 6 | 2-3 | 66.7 | 1-1 | 100.0 | 3-4 | 75.0 | 8 |
| Feb 21 | Suffolk University | W, 69-59 | - | 15 | 2-8 | 25.0 | 0-1 | 0.0 | 0-2 | 0.0 | 4 |
| Feb 24 | at Anna Maria College | W, 76-73 | 1 | 21 | 5-14 | 35.7 | 1-4 | 25.0 | 2-4 | 50.0 | 13 |
| Feb 26 | at Johnson & Wales University | L, 77-43 | 1 | 19 | 2-10 | 20.0 | 0-3 | 0.0 | 2-3 | 66.7 | 6 |
Game Log - Ball control
| Date | Opponent | Score | gs | min | off | def | reb | ast | to | stl | blk |
|---|---|---|---|---|---|---|---|---|---|---|---|
| Nov 15 | Regis College | L, 76-59 | - | 20 | 0 | 4 | 4 | 2 | 1 | 1 | 1 |
| Nov 16 | Wentworth Institute of Technology | W, 47-40 | - | 15 | 0 | 3 | 3 | 1 | 0 | 0 | 0 |
| Nov 20 | at Wesleyan University | L, 76-54 | - | 19 | 1 | 2 | 3 | 1 | 2 | 0 | 0 |
| Nov 22 | Westfield State University | L, 81-69 | - | 20 | 1 | 0 | 1 | 0 | 3 | 0 | 0 |
| Nov 25 | Wheaton College | W, 80-65 | - | 12 | 1 | 0 | 1 | 2 | 2 | 1 | 1 |
| Dec 2 | at Rivier University | L, 71-61 | - | 12 | 0 | 2 | 2 | 0 | 2 | 0 | 1 |
| Dec 4 | St. Joseph's College (ME) | L, 73-69 | - | - | - | - | - | - | - | - | - |
| Dec 6 | at Mount Ida College | W, 68-64 | - | - | - | - | - | - | - | - | - |
| Dec 9 | at #15 MIT | L, 63-42 | - | - | - | - | - | - | - | - | - |
| Jan 6 | at Suffolk University | W, 84-75 | 1 | 19 | 0 | 1 | 1 | 1 | 1 | 1 | 0 |
| Jan 8 | Lasell University | L, 71-66 | 1 | 22 | 0 | 1 | 1 | 2 | 1 | 1 | 0 |
| Jan 10 | Anna Maria College | L, 65-48 | 1 | 15 | 0 | 1 | 1 | 0 | 1 | 1 | 0 |
| Jan 14 | #12 Albertus Magnus College | L, 84-58 | - | 12 | 0 | 1 | 1 | 0 | 1 | 0 | 0 |
| Jan 17 | at Norwich University | L, 71-66 | - | 15 | 0 | 0 | 0 | 2 | 1 | 0 | 0 |
| Jan 19 | at Johnson & Wales University | L, 74-48 | - | - | - | - | - | - | - | - | - |
| Jan 29 | Rivier University | W, 60-49 | 1 | 23 | 0 | 3 | 3 | 2 | 2 | 1 | 0 |
| Jan 31 | at Lasell University | W, 59-55 | 1 | 23 | 1 | 4 | 5 | 1 | 3 | 0 | 0 |
| Feb 4 | Mount Ida College | W, 70-64 | 1 | 10 | 0 | 1 | 1 | 1 | 2 | 1 | 0 |
| Feb 7 | Johnson & Wales University | L, 79-61 | 1 | 7 | 0 | 0 | 0 | 0 | 1 | 0 | 0 |
| Feb 10 | Norwich University | W, 68-64 | 1 | 9 | 0 | 1 | 1 | 2 | 0 | 0 | 0 |
| Feb 12 | at Anna Maria College | L, 85-84 | 1 | 30 | 3 | 3 | 6 | 2 | 4 | 1 | 0 |
| Feb 14 | at St. Joseph's College (ME) | L, 70-47 | 1 | 27 | 1 | 1 | 2 | 0 | 1 | 2 | 0 |
| Feb 17 | at #7 Albertus Magnus College | L, 99-89 | - | 6 | 0 | 0 | 0 | 0 | 0 | 1 | 0 |
| Feb 21 | Suffolk University | W, 69-59 | - | 15 | 1 | 3 | 4 | 0 | 2 | 1 | 1 |
| Feb 24 | at Anna Maria College | W, 76-73 | 1 | 21 | 0 | 2 | 2 | 3 | 2 | 2 | 0 |
| Feb 26 | at Johnson & Wales University | L, 77-43 | 1 | 19 | 1 | 3 | 4 | 1 | 3 | 0 | 0 |
Game Log - Ball control extended
| Date | Opponent | Score | gs | pf | dq | a/to |
|---|---|---|---|---|---|---|
| Nov 15 | Regis College | L, 76-59 | - | 2 | 0 | 2.0 |
| Nov 16 | Wentworth Institute of Technology | W, 47-40 | - | 0 | - | - |
| Nov 20 | at Wesleyan University | L, 76-54 | - | 0 | - | 0.5 |
| Nov 22 | Westfield State University | L, 81-69 | - | 3 | - | 0.0 |
| Nov 25 | Wheaton College | W, 80-65 | - | 1 | - | 1.0 |
| Dec 2 | at Rivier University | L, 71-61 | - | 1 | - | 0.0 |
| Dec 4 | St. Joseph's College (ME) | L, 73-69 | - | - | - | - |
| Dec 6 | at Mount Ida College | W, 68-64 | - | - | - | - |
| Dec 9 | at #15 MIT | L, 63-42 | - | - | - | - |
| Jan 6 | at Suffolk University | W, 84-75 | 1 | 2 | - | 1.0 |
| Jan 8 | Lasell University | L, 71-66 | 1 | 1 | 0 | 2.0 |
| Jan 10 | Anna Maria College | L, 65-48 | 1 | 0 | - | 0.0 |
| Jan 14 | #12 Albertus Magnus College | L, 84-58 | - | 2 | 0 | 0.0 |
| Jan 17 | at Norwich University | L, 71-66 | - | 3 | - | 2.0 |
| Jan 19 | at Johnson & Wales University | L, 74-48 | - | - | - | - |
| Jan 29 | Rivier University | W, 60-49 | 1 | 3 | - | 1.0 |
| Jan 31 | at Lasell University | W, 59-55 | 1 | 1 | - | 0.3 |
| Feb 4 | Mount Ida College | W, 70-64 | 1 | 4 | 0 | 0.5 |
| Feb 7 | Johnson & Wales University | L, 79-61 | 1 | 3 | 0 | 0.0 |
| Feb 10 | Norwich University | W, 68-64 | 1 | 0 | 0 | - |
| Feb 12 | at Anna Maria College | L, 85-84 | 1 | 1 | - | 0.5 |
| Feb 14 | at St. Joseph's College (ME) | L, 70-47 | 1 | 2 | - | 0.0 |
| Feb 17 | at #7 Albertus Magnus College | L, 99-89 | - | 1 | 0 | - |
| Feb 21 | Suffolk University | W, 69-59 | - | 2 | - | 0.0 |
| Feb 24 | at Anna Maria College | W, 76-73 | 1 | 1 | - | 1.5 |
| Feb 26 | at Johnson & Wales University | L, 77-43 | 1 | 1 | 0 | 0.3 |
| gp | min/g | fg/g | 3pt/g | ft/g | ppg | |
|---|---|---|---|---|---|---|
| 2014-15 | 22 | 16.9 | 2.3-5.9 | 0.6-1.9 | 1.0-1.6 | 6.2 |
| Total | 22 | 16.9 | 2.3-5.9 | 0.6-1.9 | 1.0-1.6 | 6.2 |
Career Stats: Shooting per game
| gp | gs | min | fg | pct | 3pt | pct | ft | pct | pts | |
|---|---|---|---|---|---|---|---|---|---|---|
| 2014-15 | 22 | 12 | 371 | 51-129 | 39.5 | 13-41 | 31.7 | 21-36 | 58.3 | 136 |
| Total | 22 | 12 | 371 | 51-129 | 39.5 | 13-41 | 31.7 | 21-36 | 58.3 | 136 |
Career Stats: Shooting totals
| gp | min | min/g | fg/40 | 3pt/40 | pct | ft/40 | pts/40 | |
|---|---|---|---|---|---|---|---|---|
| 2014-15 | 22 | 371 | 16.9 | 5.5-13.9 | 1.4-4.4 | 31.7 | 2.3-3.9 | 14.7 |
| Total | 22 | 371 | 16.9 | 5.5-13.9 | 1.4-4.4 | 31.7 | 2.3-3.9 | 14.7 |
Career Stats: Shooting per 40 min
| gp | off/g | def/g | reb/g | ast/g | to/g | stl/g | blk/g | |
|---|---|---|---|---|---|---|---|---|
| 2014-15 | 22 | 0.5 | 1.6 | 2.1 | 1.0 | 1.6 | 0.6 | 0.2 |
| Total | 22 | 0.5 | 1.6 | 2.1 | 1.0 | 1.6 | 0.6 | 0.2 |
Career Stats: Ball control per game
| gp | gs | off | def | reb | ast | to | stl | blk | |
|---|---|---|---|---|---|---|---|---|---|
| 2014-15 | 22 | 12 | 10 | 36 | 46 | 23 | 35 | 14 | 4 |
| Total | 22 | 12 | 10 | 36 | 46 | 23 | 35 | 14 | 4 |
Career Stats: Ball control totals
| gp | off/40 | def/40 | reb/40 | ast/40 | to/40 | stl/40 | blk/40 | |
|---|---|---|---|---|---|---|---|---|
| 2014-15 | 22 | 1.1 | 3.9 | 5.0 | 2.5 | 3.8 | 1.5 | 0.4 |
| Total | 22 | 1.1 | 3.9 | 5.0 | 2.5 | 3.8 | 1.5 | 0.4 |
Career Stats: Ball control per 40 min
| gp | min/g | fg/g | 3pt/g | ft/g | ppg | |
|---|---|---|---|---|---|---|
| Event | ||||||
| Total | 22 | 16.9 | 2.3-5.9 | 0.6-1.9 | 1.0-1.6 | 6.2 |
| Conference | 15 | 16.3 | 2.1-5.1 | 0.4-1.5 | 0.5-0.9 | 5.0 |
| Exhibition | - | - | 0.0-0.0 | 0.0-0.0 | 0.0-0.0 | - |
| Location | ||||||
| Home | 12 | 15.0 | 1.8-5.3 | 0.3-1.6 | 0.6-1.2 | 4.6 |
| Away | 10 | 19.1 | 2.9-6.5 | 0.9-2.2 | 1.4-2.2 | 8.1 |
| Neutral | - | - | 0.0-0.0 | 0.0-0.0 | 0.0-0.0 | - |
| Result | ||||||
| Wins | 9 | 16.3 | 2.3-5.9 | 0.6-1.9 | 1.0-1.8 | 6.2 |
| Losses | 13 | 17.2 | 2.3-5.8 | 0.6-1.8 | 0.9-1.5 | 6.2 |
| Month | ||||||
| November | 5 | 17.2 | 2.6-5.8 | 1.2-2.2 | 2.0-3.2 | 8.4 |
| December | 1 | 12.0 | 1.0-4.0 | 0.0-1.0 | 0.0-0.0 | 2.0 |
| January | 7 | 18.4 | 1.9-4.6 | 0.3-1.1 | 0.6-0.9 | 4.6 |
| February | 9 | 16.0 | 2.7-7.1 | 0.6-2.3 | 0.8-1.6 | 6.7 |
Splits Stats: Shooting per game
| gp | gs | min | fg | pct | 3pt | pct | ft | pct | pts | |
|---|---|---|---|---|---|---|---|---|---|---|
| Event | ||||||||||
| Total | 22 | 12 | 371 | 51-129 | 39.5 | 13-41 | 31.7 | 21-36 | 58.3 | 136 |
| Conference | 15 | 10 | 245 | 31-76 | 40.8 | 6-23 | 26.1 | 7-13 | 53.8 | 75 |
| Exhibition | - | - | - | 0-0 | - | 0-0 | - | 0-0 | - | 0 |
| Location | ||||||||||
| Home | 12 | 6 | 180 | 22-64 | 34.4 | 4-19 | 21.1 | 7-14 | 50.0 | 55 |
| Away | 10 | 6 | 191 | 29-65 | 44.6 | 9-22 | 40.9 | 14-22 | 63.6 | 81 |
| Neutral | - | - | - | 0-0 | - | 0-0 | - | 0-0 | - | 0 |
| Result | ||||||||||
| Wins | 9 | 6 | 147 | 21-53 | 39.6 | 5-17 | 29.4 | 9-16 | 56.3 | 56 |
| Losses | 13 | 6 | 224 | 30-76 | 39.5 | 8-24 | 33.3 | 12-20 | 60.0 | 80 |
| Month | ||||||||||
| November | 5 | - | 86 | 13-29 | 44.8 | 6-11 | 54.5 | 10-16 | 62.5 | 42 |
| December | 1 | - | 12 | 1-4 | 25.0 | 0-1 | 0.0 | 0-0 | - | 2 |
| January | 7 | 5 | 129 | 13-32 | 40.6 | 2-8 | 25.0 | 4-6 | 66.7 | 32 |
| February | 9 | 7 | 144 | 24-64 | 37.5 | 5-21 | 23.8 | 7-14 | 50.0 | 60 |
Splits Stats: Shooting totals
| gp | min | min/g | fg/40 | 3pt/40 | pct | ft/40 | pts/40 | |
|---|---|---|---|---|---|---|---|---|
| Event | ||||||||
| Total | 22 | 371 | 16.9 | 5.5-13.9 | 1.4-4.4 | 31.7 | 2.3-3.9 | 14.7 |
| Conference | 15 | 245 | 16.3 | 5.1-12.4 | 1.0-3.8 | 26.1 | 1.1-2.1 | 12.2 |
| Exhibition | - | - | - | 0.0-0.0 | 0.0-0.0 | - | 0.0-0.0 | - |
| Location | ||||||||
| Home | 12 | 180 | 15.0 | 4.9-14.2 | 0.9-4.2 | 21.1 | 1.6-3.1 | 12.2 |
| Away | 10 | 191 | 19.1 | 6.1-13.6 | 1.9-4.6 | 40.9 | 2.9-4.6 | 17.0 |
| Neutral | - | - | - | 0.0-0.0 | 0.0-0.0 | - | 0.0-0.0 | - |
| Result | ||||||||
| Wins | 9 | 147 | 16.3 | 5.7-14.4 | 1.4-4.6 | 29.4 | 2.4-4.4 | 15.2 |
| Losses | 13 | 224 | 17.2 | 5.4-13.6 | 1.4-4.3 | 33.3 | 2.1-3.6 | 14.3 |
| Month | ||||||||
| November | 5 | 86 | 17.2 | 6.0-13.5 | 2.8-5.1 | 54.5 | 4.7-7.4 | 19.5 |
| December | 1 | 12 | 12.0 | 3.3-13.3 | 0.0-3.3 | 0.0 | 0.0-0.0 | 6.7 |
| January | 7 | 129 | 18.4 | 4.0-9.9 | 0.6-2.5 | 25.0 | 1.2-1.9 | 9.9 |
| February | 9 | 144 | 16.0 | 6.7-17.8 | 1.4-5.8 | 23.8 | 1.9-3.9 | 16.7 |
Splits Stats: Shooting per 40 min
| gp | off/g | def/g | reb/g | ast/g | to/g | stl/g | blk/g | |
|---|---|---|---|---|---|---|---|---|
| Event | ||||||||
| Total | 22 | 0.5 | 1.6 | 2.1 | 1.0 | 1.6 | 0.6 | 0.2 |
| Conference | 15 | 0.4 | 1.5 | 1.9 | 0.9 | 1.5 | 0.7 | 0.1 |
| Exhibition | - | - | - | - | - | - | - | - |
| Location | ||||||||
| Home | 12 | 0.3 | 1.5 | 1.8 | 1.0 | 1.3 | 0.6 | 0.3 |
| Away | 10 | 0.7 | 1.8 | 2.5 | 1.1 | 1.9 | 0.7 | 0.1 |
| Neutral | - | - | - | - | - | - | - | - |
| Result | ||||||||
| Wins | 9 | 0.3 | 2.0 | 2.3 | 1.4 | 1.6 | 0.8 | 0.2 |
| Losses | 13 | 0.5 | 1.4 | 1.9 | 0.8 | 1.6 | 0.5 | 0.2 |
| Month | ||||||||
| November | 5 | 0.6 | 1.8 | 2.4 | 1.2 | 1.6 | 0.4 | 0.4 |
| December | 1 | 0.0 | 2.0 | 2.0 | 0.0 | 2.0 | 0.0 | 1.0 |
| January | 7 | 0.1 | 1.6 | 1.7 | 1.1 | 1.4 | 0.6 | 0.0 |
| February | 9 | 0.7 | 1.6 | 2.2 | 1.0 | 1.7 | 0.9 | 0.1 |
Splits Stats: Ball control per game
| gp | gs | off | def | reb | ast | to | stl | blk | |
|---|---|---|---|---|---|---|---|---|---|
| Event | |||||||||
| Total | 22 | 12 | 10 | 36 | 46 | 23 | 35 | 14 | 4 |
| Conference | 15 | 10 | 6 | 22 | 28 | 13 | 22 | 10 | 2 |
| Exhibition | - | - | - | - | - | - | - | - | - |
| Location | |||||||||
| Home | 12 | 6 | 3 | 18 | 21 | 12 | 16 | 7 | 3 |
| Away | 10 | 6 | 7 | 18 | 25 | 11 | 19 | 7 | 1 |
| Neutral | - | - | - | - | - | - | - | - | - |
| Result | |||||||||
| Wins | 9 | 6 | 3 | 18 | 21 | 13 | 14 | 7 | 2 |
| Losses | 13 | 6 | 7 | 18 | 25 | 10 | 21 | 7 | 2 |
| Month | |||||||||
| November | 5 | - | 3 | 9 | 12 | 6 | 8 | 2 | 2 |
| December | 1 | - | 0 | 2 | 2 | 0 | 2 | 0 | 1 |
| January | 7 | 5 | 1 | 11 | 12 | 8 | 10 | 4 | 0 |
| February | 9 | 7 | 6 | 14 | 20 | 9 | 15 | 8 | 1 |
Splits Stats: Ball control totals
| gp | off/40 | def/40 | reb/40 | ast/40 | to/40 | stl/40 | blk/40 | |
|---|---|---|---|---|---|---|---|---|
| Event | ||||||||
| Total | 22 | 1.1 | 3.9 | 5.0 | 2.5 | 3.8 | 1.5 | 0.4 |
| Conference | 15 | 1.0 | 3.6 | 4.6 | 2.1 | 3.6 | 1.6 | 0.3 |
| Exhibition | - | - | - | - | - | - | - | - |
| Location | ||||||||
| Home | 12 | 0.7 | 4.0 | 4.7 | 2.7 | 3.6 | 1.6 | 0.7 |
| Away | 10 | 1.5 | 3.8 | 5.2 | 2.3 | 4.0 | 1.5 | 0.2 |
| Neutral | - | - | - | - | - | - | - | - |
| Result | ||||||||
| Wins | 9 | 0.8 | 4.9 | 5.7 | 3.5 | 3.8 | 1.9 | 0.5 |
| Losses | 13 | 1.3 | 3.2 | 4.5 | 1.8 | 3.8 | 1.3 | 0.4 |
| Month | ||||||||
| November | 5 | 1.4 | 4.2 | 5.6 | 2.8 | 3.7 | 0.9 | 0.9 |
| December | 1 | 0.0 | 6.7 | 6.7 | 0.0 | 6.7 | 0.0 | 3.3 |
| January | 7 | 0.3 | 3.4 | 3.7 | 2.5 | 3.1 | 1.2 | 0.0 |
| February | 9 | 1.7 | 3.9 | 5.6 | 2.5 | 4.2 | 2.2 | 0.3 |
Splits Stats: Ball control per 40 min